PAROLE GRANT RATES
Historically, the Board’s official parole hearing grant rates were calculated as the percentage of scheduled parole hearings that result in a grant of parole. However, this number is often misunderstood because a scheduled parole hearing can result in a grant, denial, stipulation, voluntary waiver, postponement, cancellation, or continuance.
For example, in 2019 the Board scheduled 6,061 hearings resulting in the following outcomes:

One might assume that if 20% of scheduled hearings resulted in a grant in 2019, it stands to reason that the remaining 80% resulted in a denial of parole. As you can see from the Figure 4 above, that is not true. There was no decision rendered concerning the person’s parole suitability in 1,960 scheduled hearings because the person voluntarily waived his or her hearing or the hearing was postponed, continued, or cancelled.
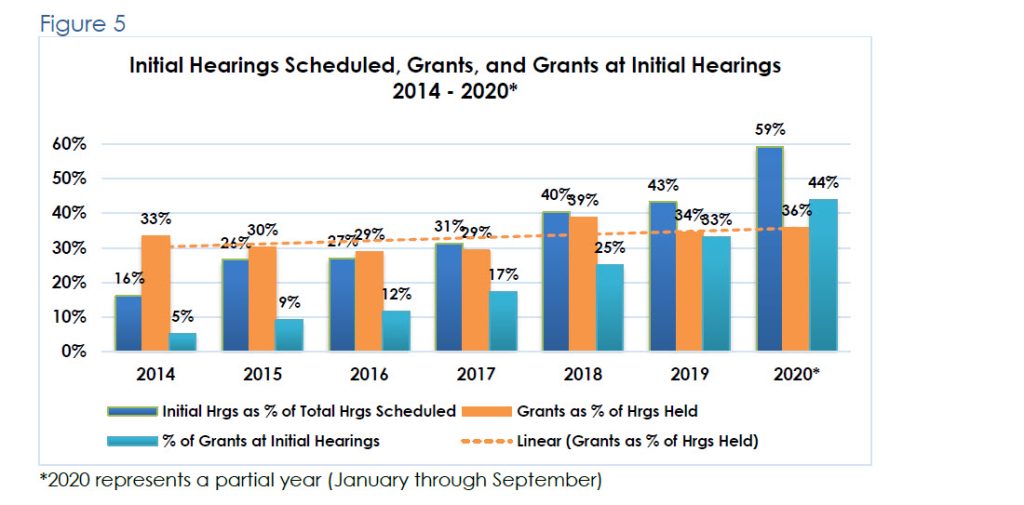
For this reason, it is often more illuminating to review grants as a percentage of hearings held. As shown in Figure 5 below, the percentage of hearings held resulting in a grant has generally increased over the past seven years, ranging from 29 to 39 percent of all hearings held. This has occurred despite the dramatic increase in the percentage of hearings scheduled each year for persons who have never before had a parole hearing (from 16% of scheduled hearings in 2014 to 59% in 2020). This means more persons are being found suitable for parole at their first hearing (5% of grants were at initial hearings in 2014 versus 44% in 2020).
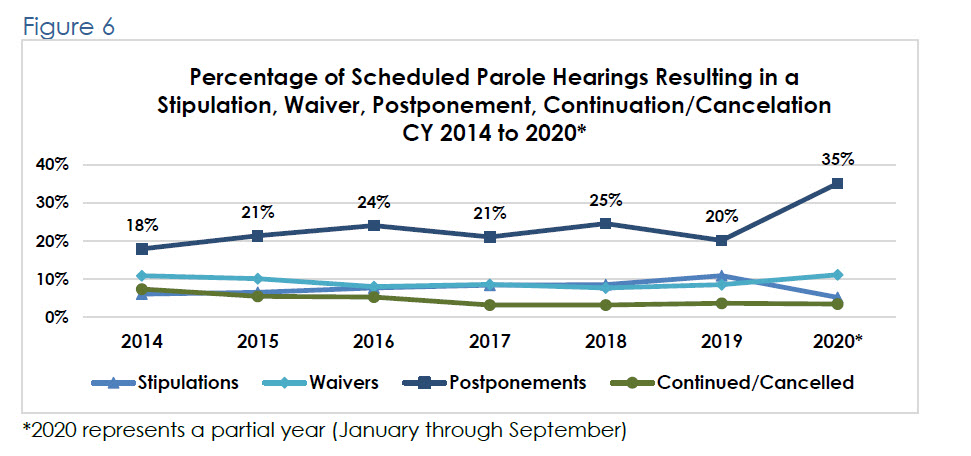
While the grant rate for hearings held has generally increased, the percentage of scheduled hearings resulting in a waiver, stipulation, postponement, continuation or cancellation have remained relatively unchanged, as shown below in Figure 6. One anomaly is the rate of postponements in 2020, which increased as a result of the COVID-19 pandemic. The Board postponed 650 hearings in March and April 2020 as it transitioned from conducting hearings in person to conducting hearings by videoconference.
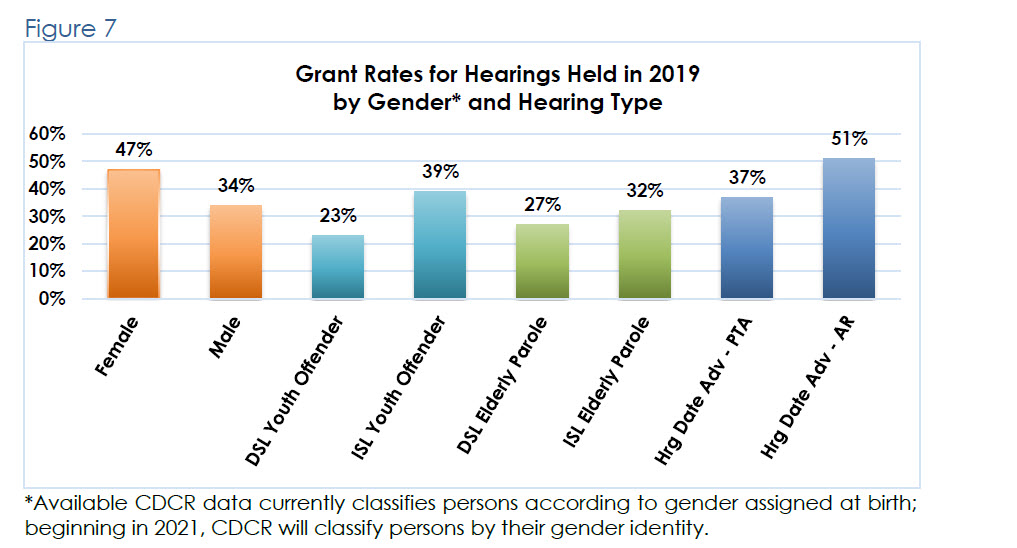
In addition, as shown in Figure 7 below, grant rates vary considerably depending on a variety factors. For example, although the overall grant rate for hearings held in 2019 was 34 percent (as shown above in Figure 5), grant rates varied from 23 percent for determinately-sentenced youth offenders to 51 percent for hearings held as a result of the Board advancing the inmate’s parole hearing date.